Recently, I was reading through astrologer Bruce Scofield’s doctoral
dissertation entitled A History and Test of Planetary Weather Forecasting, which he submitted to the University of
Massachusetts Amherst in May of 2010. This 249-page dissertation examines the
history of astrometeorology, which is a methodology for forecasting weather
patterns based on geocentric planetary alignments. As readers of this blog
know, that is the subject presented here at The
Weather Alternative. Bruce’s dissertation also presents a test of
astrometeorology.
Bruce’s hypothesis states that there is a correlation, shown in daily
temperature records, between cooling trends in specific regions and the
geocentric alignments of the Sun and the planet Saturn. He uses modern daily
temperature data from New England, Central England, Prague, and other
locations. He finds that his hypothesis is supported by a number of tests that
show lower temperatures on days when the Sun-Saturn alignments occur,
especially when near the equinoxes. In particular, he studies the opposition
aspect between the Sun and Saturn.
The astrometeorological method takes into account a number of factors when
determining weather forecasts. First, the time of the aspect in question is
noted. By this I mean the day or days when those aspects among the Sun and
planets form. Second, the nature of the planets in aspect must be considered. Do
the astrometeorological natures of the planets involved in the aspect point
toward cold, wind, heat, storms etc.? These natures have been handed down to us
by previous weather forecasters of past centuries. Third, certain key charts
are used to determine where on earth the influence of the aspect will manifest.
Just because a certain aspect might signify cold weather does not mean the
whole earth will feel this influence. These key charts localize the influence
of the planets in question to certain geographical areas. Now, for whatever
reasons, as I understand his test, Bruce deals with the Sun-Saturn oppositions without
the localizing effect of these key charts.
I thought I’d give a look at some past Sun-Saturn oppositions with the aid
of one of the most important key charts, see where the effects would be
localized, and then check the weather for those dates to see if they correspond
to the weather experienced. All of the astrometeorological authors, as Bruce
points out, agree that Saturn was associated with cold weather. We also find
that these same authors associated the Sun-Saturn opposition with stormy
periods that delivered rain, snow, hail etc. depending on the season. I’ve
used, in each case, the key seasonal chart to localize the influence of the
Sun-Saturn opposition. For the winter season, this means the chart for the
Sun’s ingress into Capricorn and for the spring season, the Sun’s ingress into
Aries. I found a number of seasonal charts that placed the Sun-Saturn
opposition over or near the continental United States. I confined my research
to these since I have past weather records for the U.S. The first map is for the Sun-Saturn opposition of February 10, 2007. As
shown below, the key chart placed the Sun and Saturn off the U.S. West Coast. This
would signify an area of great concentration of the cold and storminess
promised by the opposition, which would then travel in eastward motion as
weather patterns do at those latitudes.

The Weather Channel map for Feb 10, 2007 shows a cold front and stormy conditions (both expected from the opposition) affecting the West Coast states.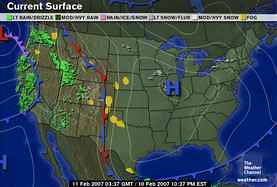
On the 10th, the Weather Channel reported: Several storm systems will move into the West bringing rain to the lower elevations and welcome snow the mountains and ski resorts. One of these weather systems will move into Southern California on Sunday (Feb 11) bringing showers to Los Angeles and San Diego with snow above 6000 feet. Snow levels will fall to around 5000 feet in the Sierra Nevada where over a foot of additional snow is forecast by Sunday night. The Wasatch in Utah are forecast to pick up generally as much as 12 inches of new snow above 6000 feet with rain in Salt Lake City.
February 24, 2008
The key chart for the Sun-Saturn opposition of Feb 24, 2008 also placed the Sun and Saturn over the West Coast states as shown in the astro-locality map below.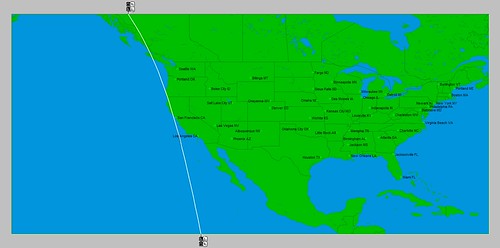
The following Accuweather map is for Feb 24, 2008. Is shows heavy rain and blizzard conditions affecting California.
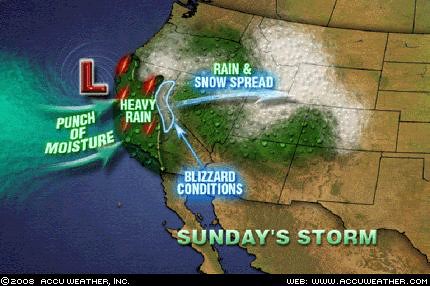
Accuweather reported the following on the 24th: A powerful storm will continue to blast California with rain, burying mountain snow and howling winds today. A yardstick will be needed to measure the snow that falls in the Sierra through tonight. The storm will bury the ski resorts above 7,000 feet with a total of 3 to 5 feet of snow.
March 8, 2009
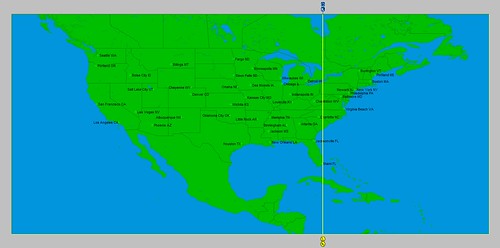
The next key chart places the Sun-Saturn opposition of Mar 8, 2009 over the Plains.
The Weather Channel map below for the 7th, shows a powerful storm system hitting the Plains, which continued for a couple of days.
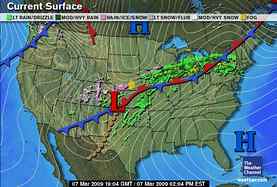
Accuweather headlines on the 7th read: Two Snowstorms Slam Central Plains The first in a pair of snowstorms will blanket the ground with fresh coating of snow from northern Nebraska northeastward into southern Ontario this weekend. The second storm could bring blizzard conditions and heavy snowfall along a similar path, potentially paralyzing travel over some areas and ushering in a wintry blast of cold air.
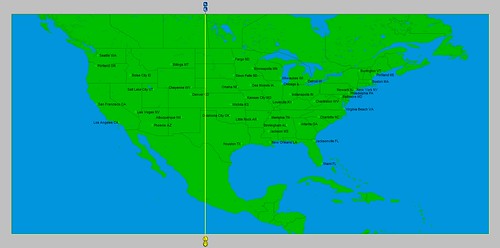
March 21, 2010
The key chart for the spring season placed the Sun-Saturn opposition over the eastern U.S.
The following Weather Channel map is for the 22nd and shows a strong storm system over the exact same area.

Accuweather reported that locally strong thunderstorms were affecting the Southeast. “The thunderstorms are being triggered by the clash of two distinctly different air masses. Colder air is invading the Southeast, where mild and more moist air currently resides.” They also stated that within a few days biting cold air would take a shot at the Midwest and Northeast.
Conclusion
I think including the locality information provided by the key charts in these examples has served to confirm traditional notions about the effect of Sun-Saturn oppositions. The March 8, 2009 storm was one that I predicted in the preceding February by this astrometeorological method. Click here.
Fall Weather 2012: Eastern U.S.
Fall Weather 2012: New England
Fall Weather 2012: Central U.S.
Fall Weather 2012: The U.S. West Coast
Mars Conjunct Saturn August 15, 2012
Jupiter-Neptune and Heavy Rain
The Solar Eclipse of November 13, 2012
Long-range effects of the May 20, 2012 Solar Eclipse
Long-range effects of the May 20, 2012 Solar Eclipse Part 2
Hurricane Season 2011 Forecast Results
Hurricane Risk-Management
New Weather Alternative Website
Overview of UK Winter 2012-13
The Winters of 2011-14
Fulfilled Long-range Forecasts for Hurricane Season 2010
Introduction to the Weather Alternative
Darwin Dissenter
Thomas Nagel, atheist and philosopher professor at New York University, finds significant weaknesses in neo-Darwinian evolution and chemical evolution. He published his view in a new Oxford University Press book Mind & Cosmos: Why the Materialist Neo-Darwinian Conception of Nature is Almost Certainly False. Click here for some intriguing quotes.
3 comments:
Thank you , ken for the research.
We all benefit when you post!
Sue Miller
I had to narrow down the "effects" of Sun-Saturn aspects to just one - cold - in order to use the most quantifiable data I had - daily temperature records. For most tests I chose to use the mean, because that's all you get in older datasets. This left me in a situation where the time of the aspect was not used in the study except to locate in the event within the 24 hours of a day.
Hi, Bruce. Thanks for your comment. I was quite encouraged by the results I got using the Cardinal Solar Ingress charts as my guide in determining where the Sun-Saturn opposition manifest. I've continued to do the same for previous years but have not posted those results yet. I'd like to go back as far as I can -- weather records permitting. Let me know any other thoughts you may have. -- Ken
Post a Comment